Lab 04: Forces and Moments on a Canard Delta Wing
AE 315 · Experimental Aerodynamics · Spring 2025 · ERAU
Experiment Overview
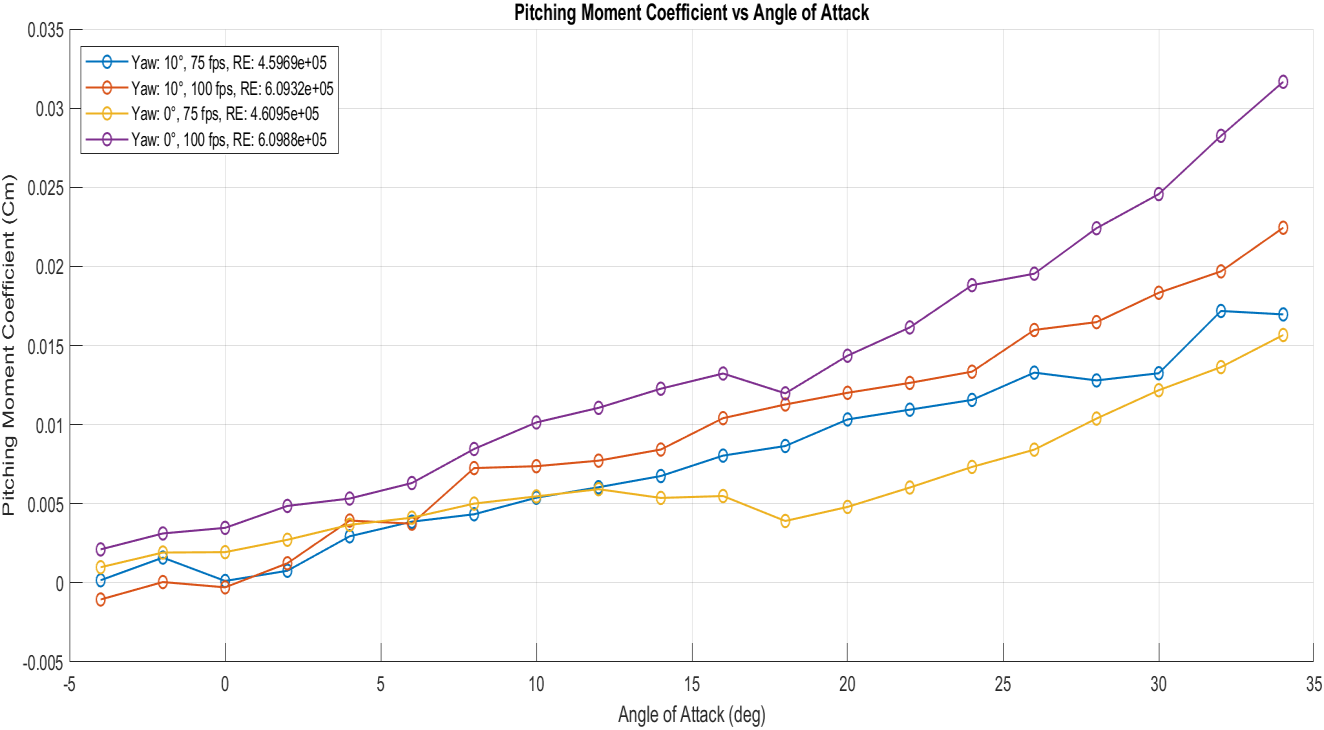
Delta wing and canard configurations appear on high-performance aircraft like the Eurofighter and Saab Gripen because they sustain lift at extreme angles of attack through leading-edge vortex lift — a mechanism conventional airfoils cannot exploit. This lab used the ERAU Micaplex closed-circuit wind tunnel’s six-component force balance to measure the complete aerodynamic load set on a canard-delta model across a wide operating envelope, giving direct exposure to how professional wind tunnel testing is conducted.
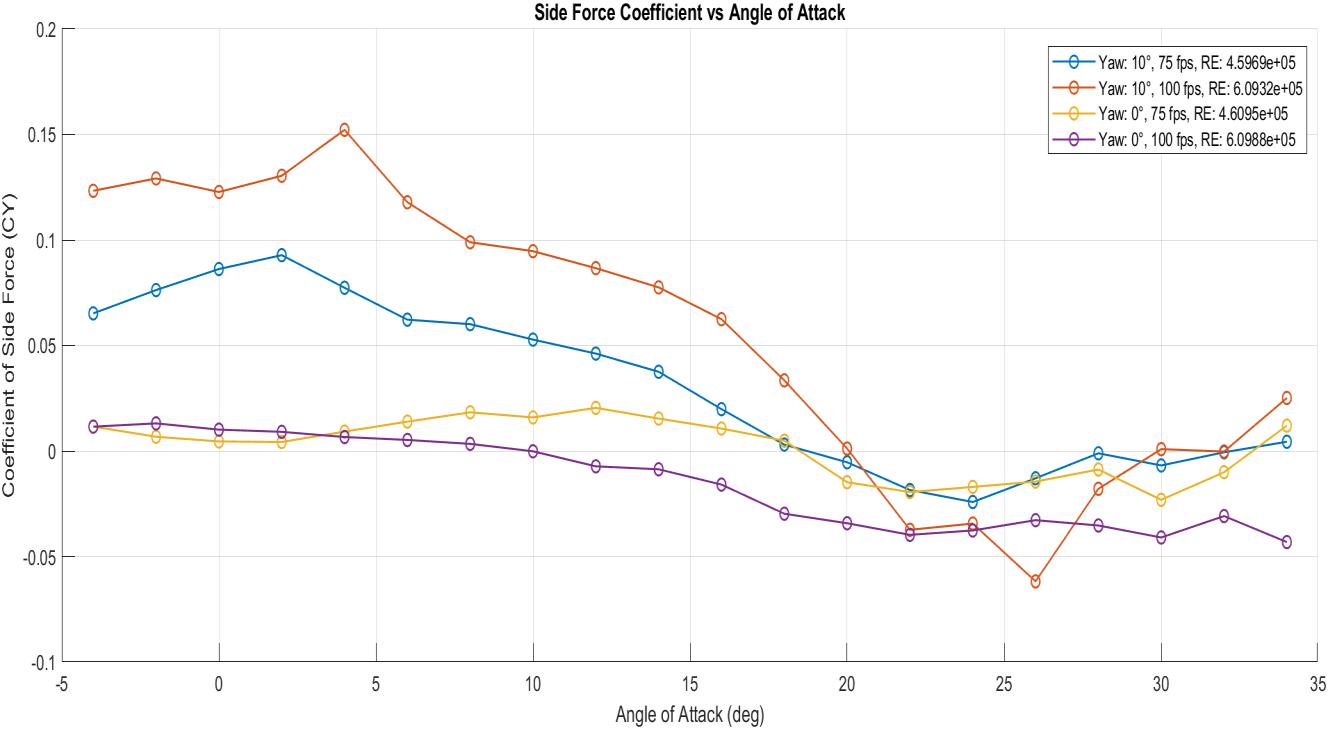
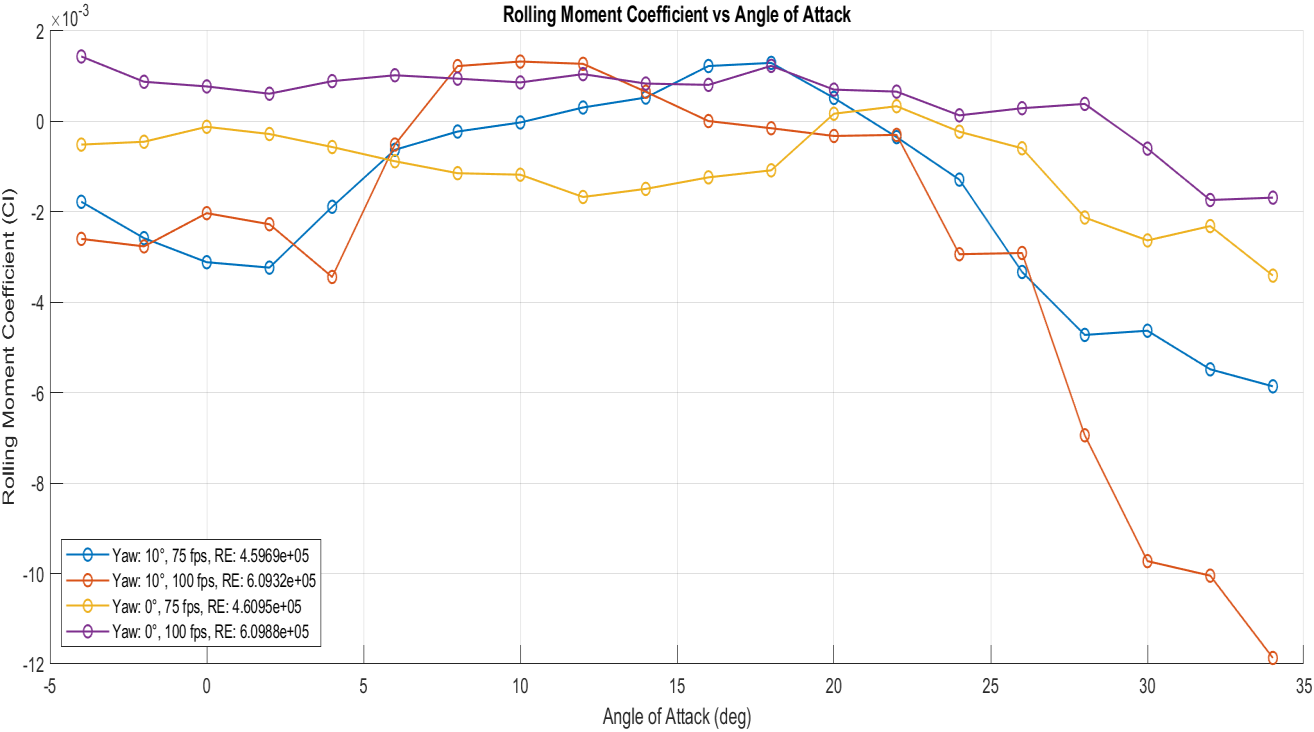
- Measure all six aerodynamic loads: lift, drag, side force, and pitching, rolling, and yawing moments
- Apply aerodynamic tares using the image–invert method to remove structural interference from force balance readings
- Compare performance at two Reynolds numbers and two yaw angles across angles of attack from −4° to 34°
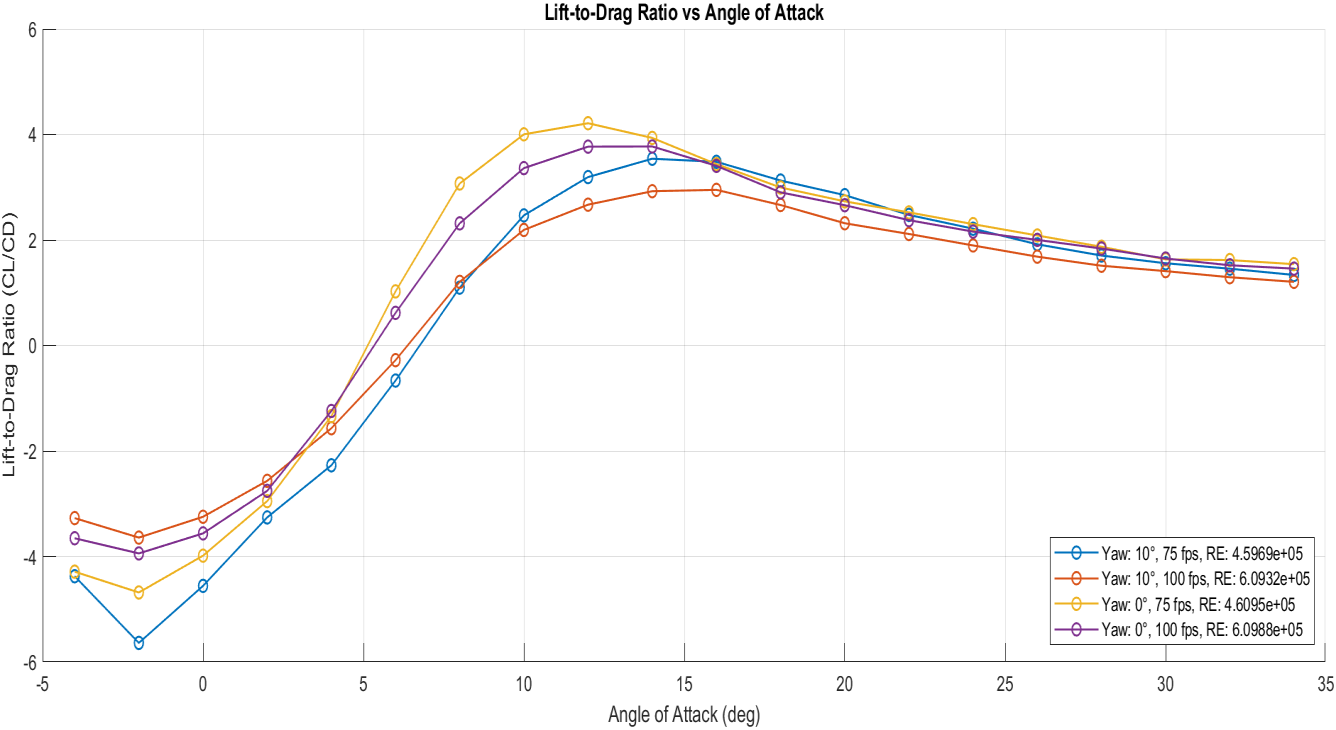
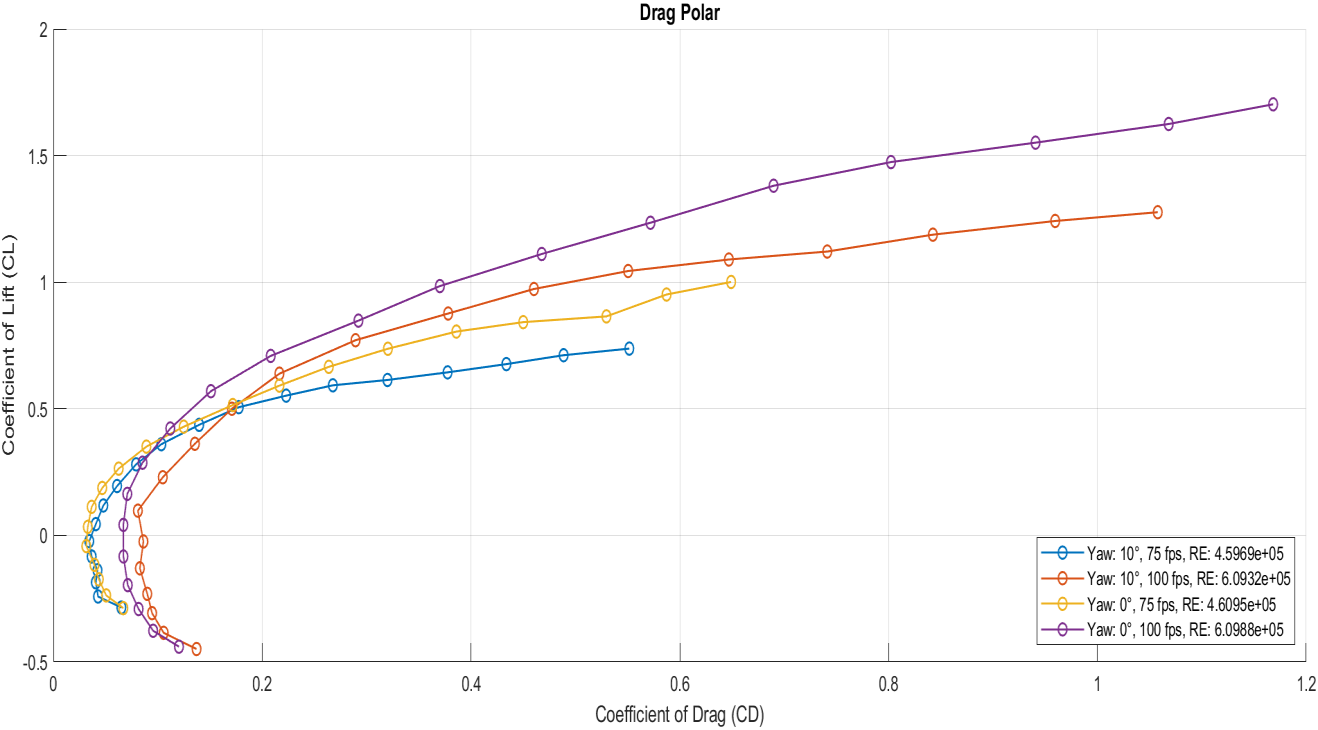
- Build a drag polar and identify the best CL/CD operating point for each test condition
Equipment & Tools
- ERAU Micaplex closed-circuit wind tunnel (75 fps and 100 fps test speeds)
- Canard-delta wing model (Sw = 242.01 in², bw = 24.5 in, cw = 9.88 in)
- WAFBC six-component external force balance (sting-mounted)
- Aerodynamic tare hardware: image and invert mounting configurations
- MATLAB for tare correction, coefficient computation, and polar plotting
Approach & Key Equations
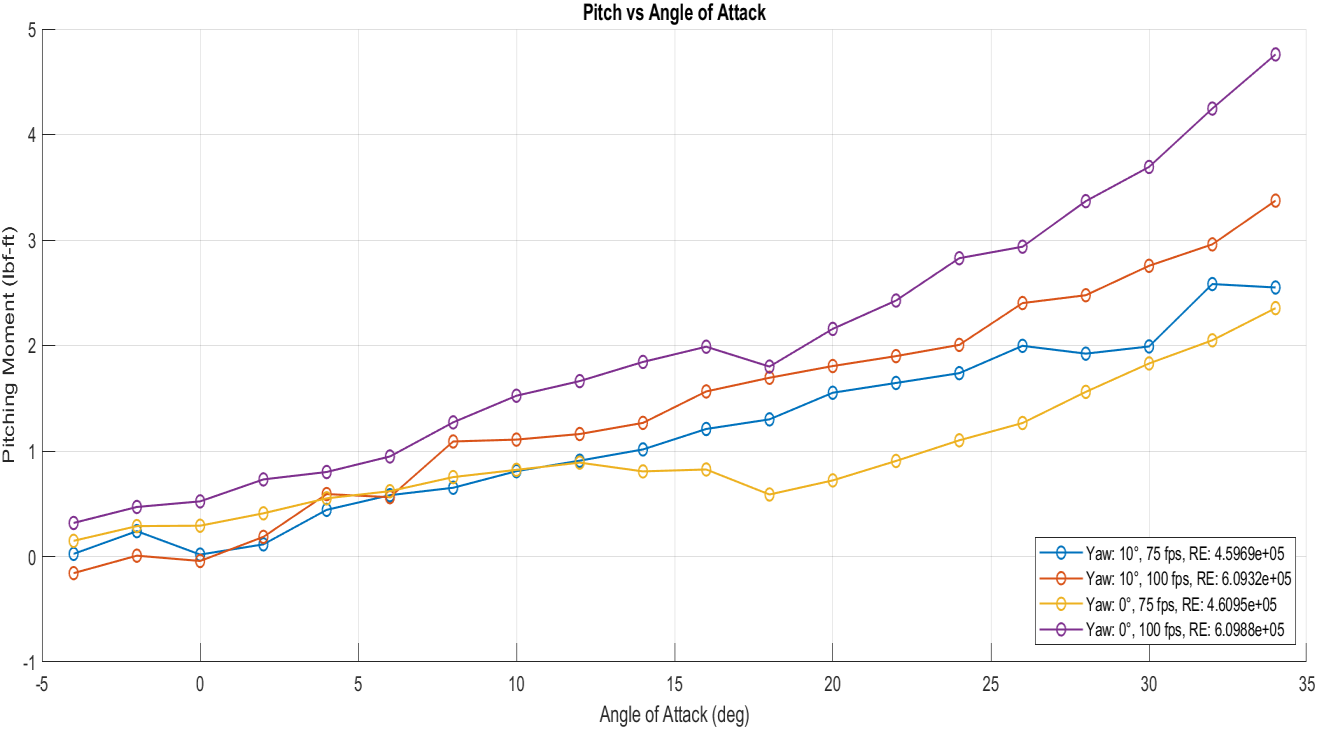
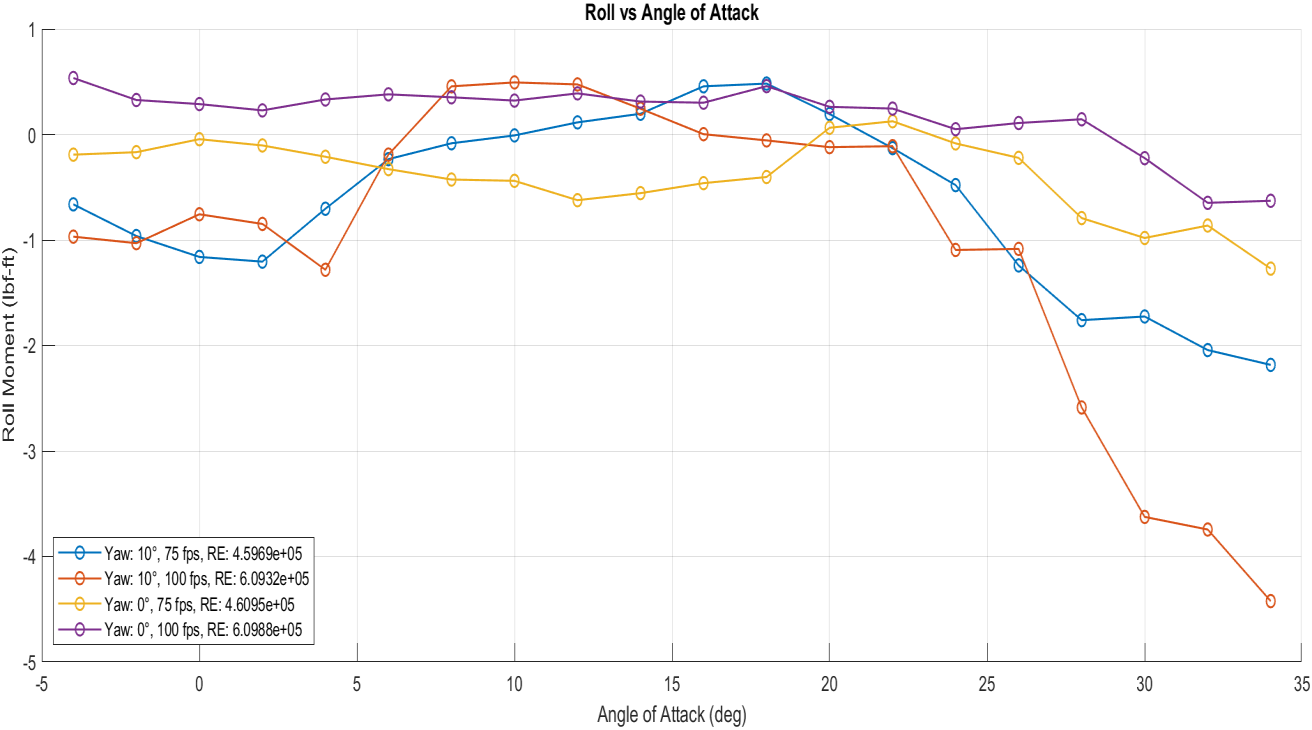
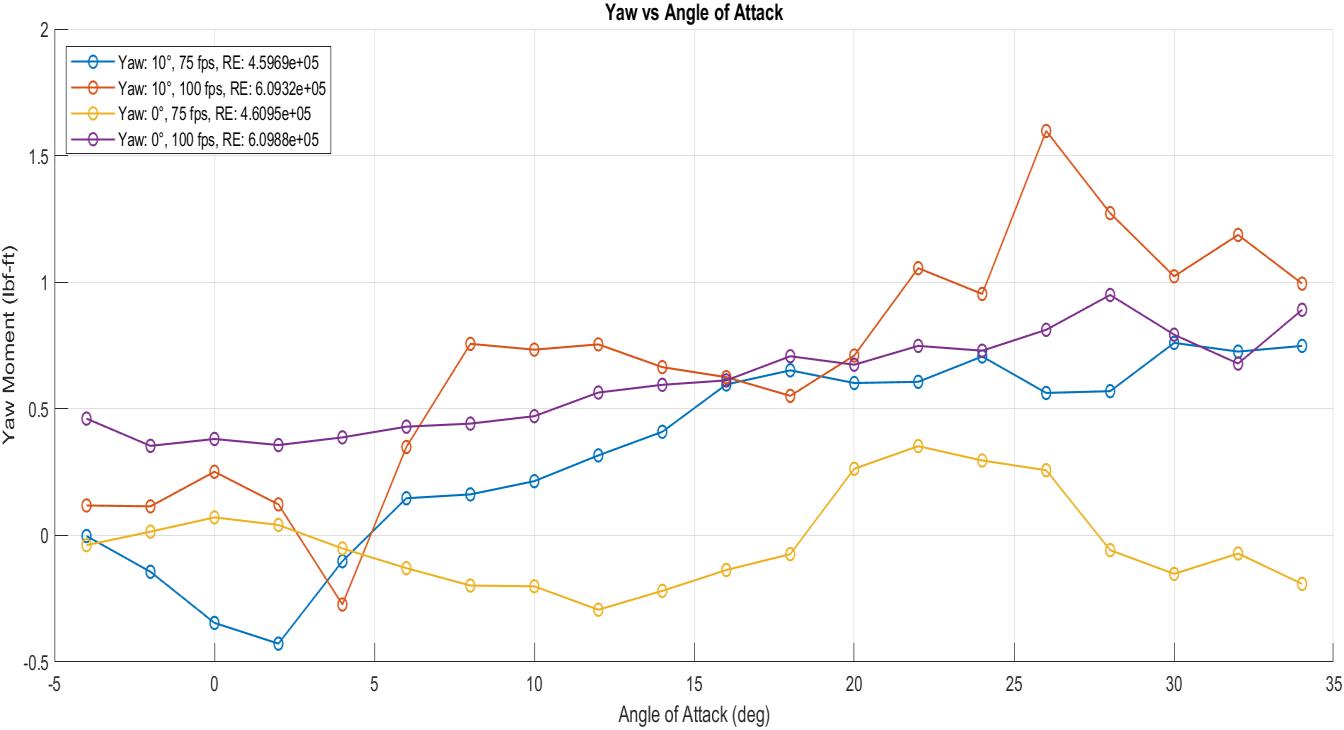
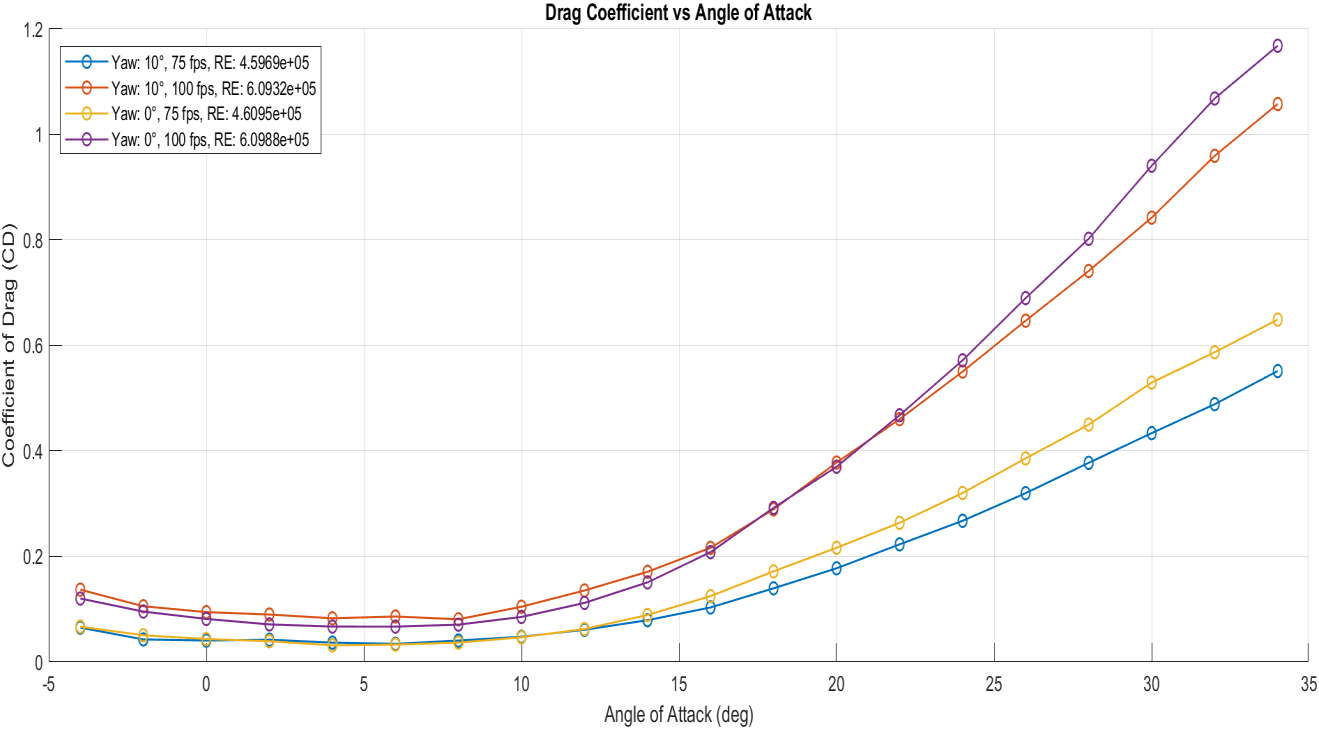
The model was tested at four conditions — 75 fps and 100 fps, at 0° and 10° yaw — while angle of attack swept from −4° to 34° in 2° steps. Raw balance outputs were corrected using the image-invert tare procedure, then non-dimensionalized by dynamic pressure q and reference area Sw:
CL = Lift / (q·Sw) CD = Drag / (q·Sw) Cm = Pitch / (q·Sw·cw)
A quadratic curve fit to the drag polar (CD = CD0 + K·CL²) extracted the parasitic drag and induced drag factor K for each condition. Reynolds numbers were computed from the “Reynolds Number per ft” channel in the raw tunnel data.
Key Results
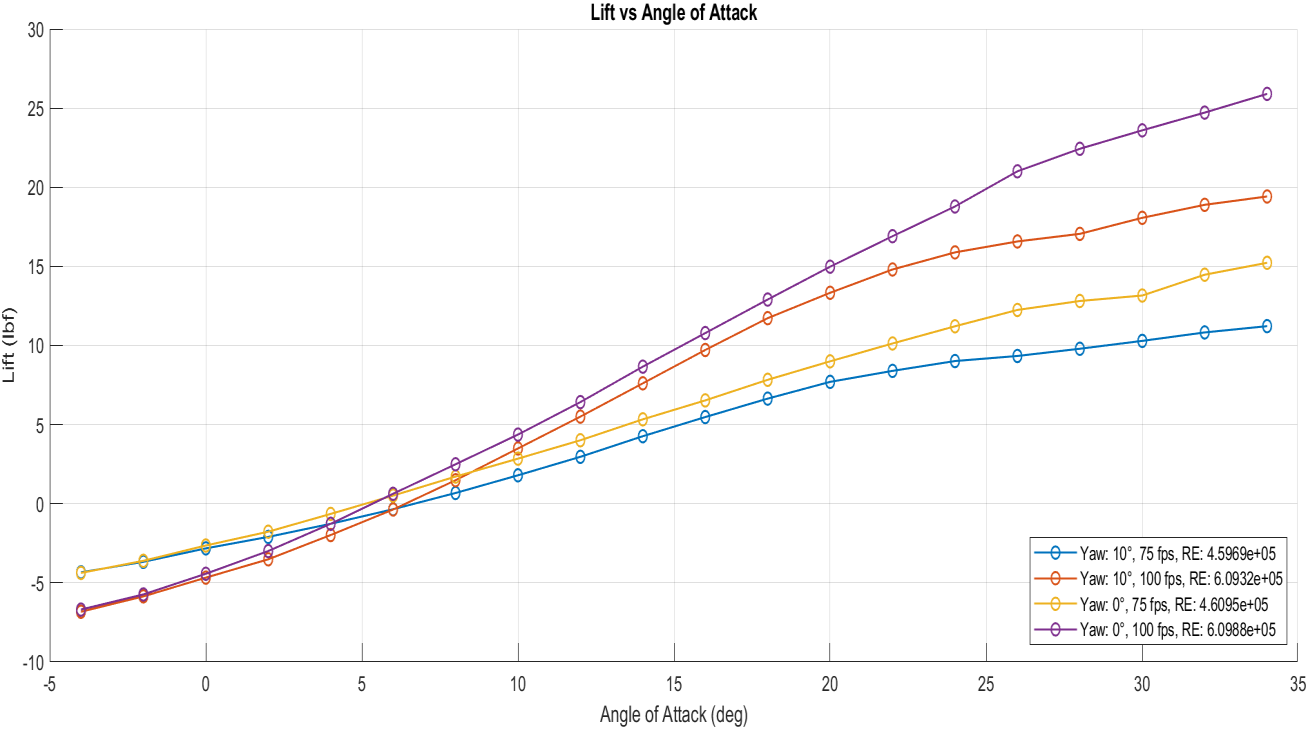
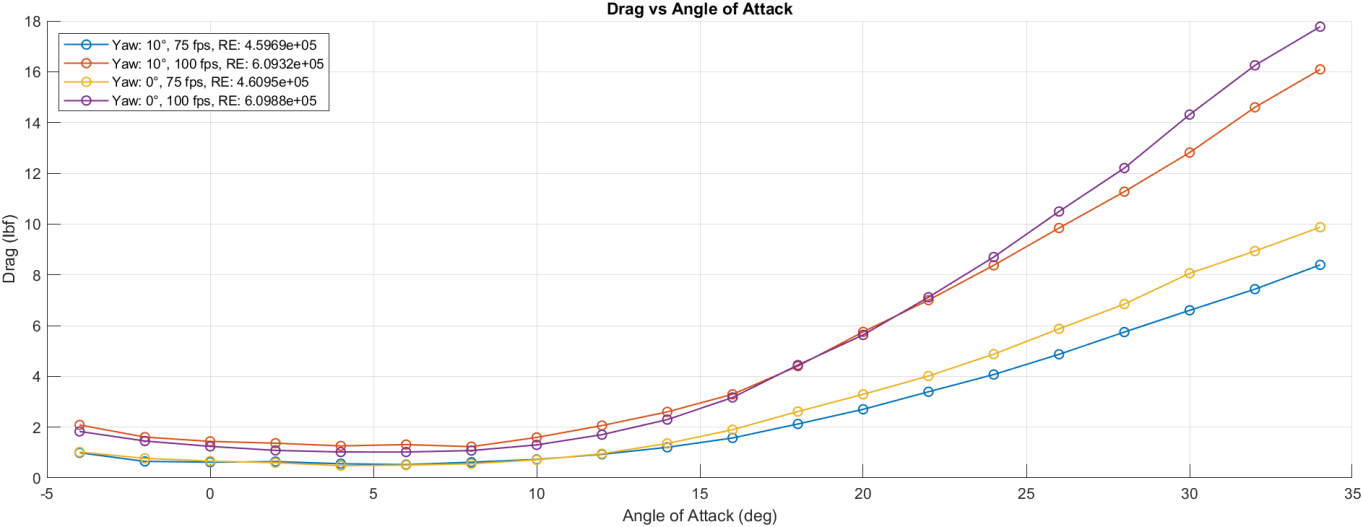
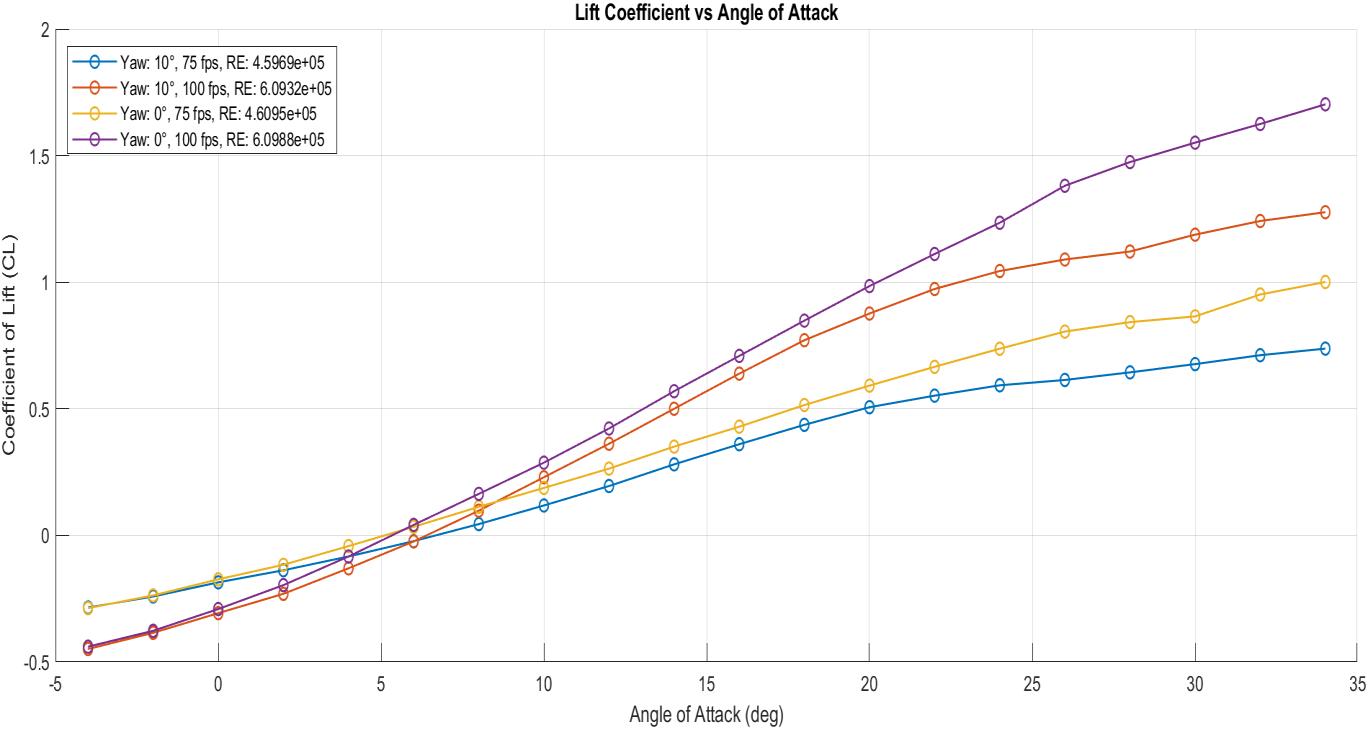
- CL increased nearly linearly up to ~25°, then gradually rolled off — the signature of vortex lift breakdown on a delta wing rather than the abrupt stall of a conventional airfoil.
- Higher Reynolds number (100 fps) produced marginally higher CL and lower CD, confirming that better flow attachment at higher Re improves overall efficiency.
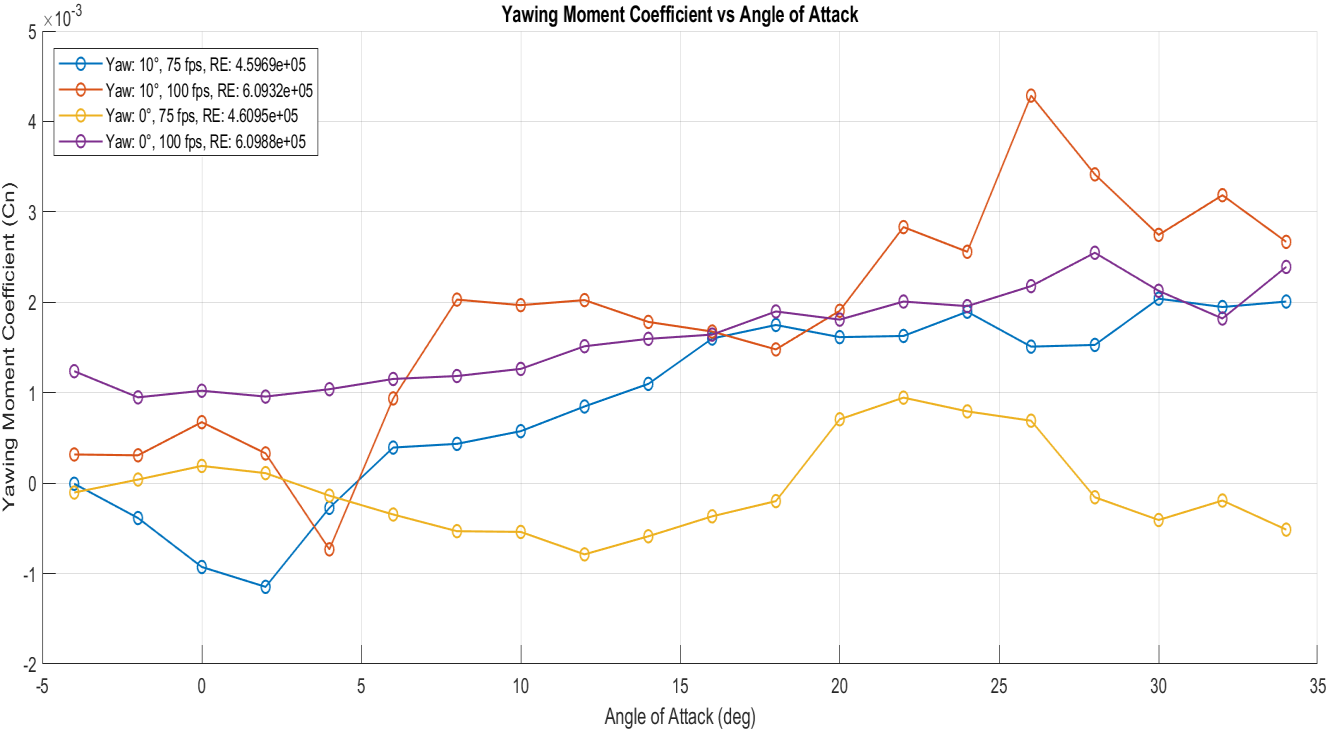
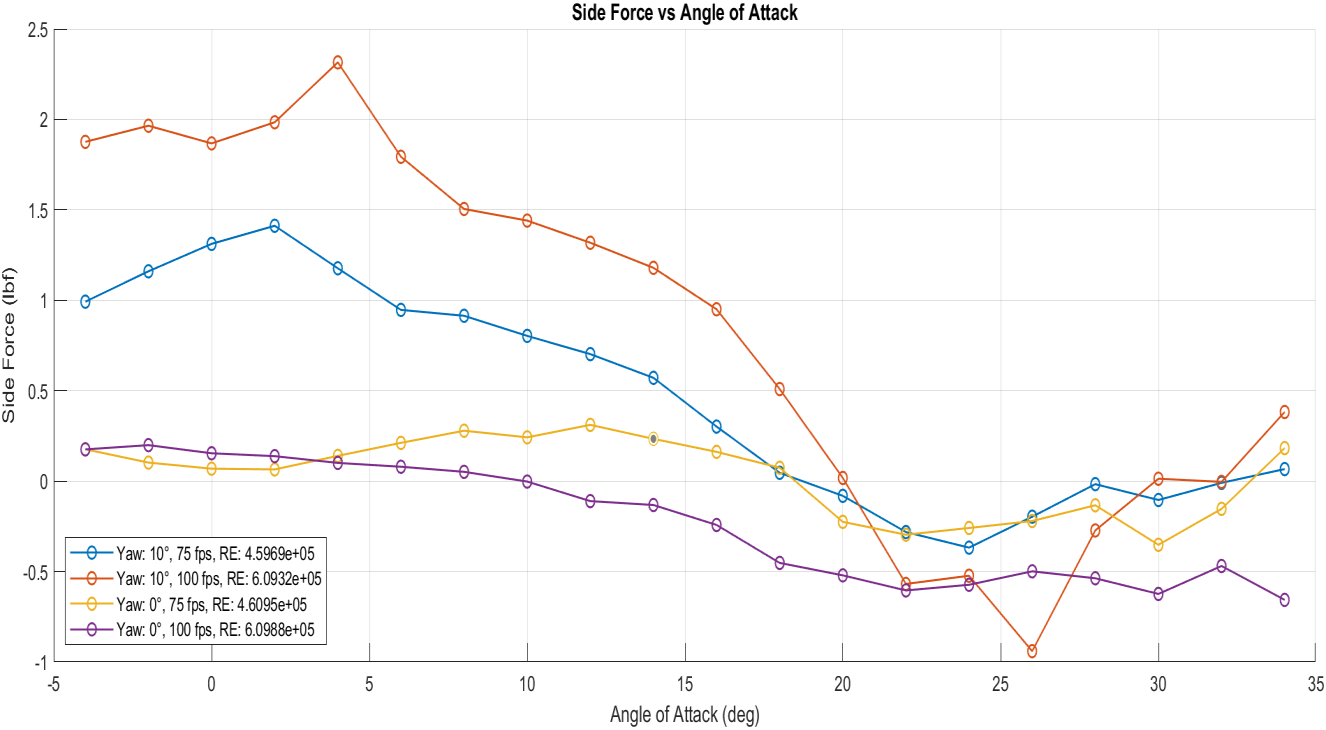
- 10° yaw had negligible effect on lift but measurably increased side force and yawing moment — important considerations for directional stability analysis.
- Best CL/CD = 4.21 at 12° AoA (75 fps, 0° yaw). Higher yaw and higher Re both reduced the peak efficiency ratio.
| Speed | Yaw | Best CL/CD | AoA |
|---|---|---|---|
| 75 fps | 0° | 4.21 | 12° |
| 100 fps | 0° | 3.77 | 12° |
| 75 fps | 10° | 3.19 | 12° |
| 100 fps | 10° | 2.67 | 12° |
Valuable Takeaways
- Delta wings don’t stall abruptly — they tolerate high angles of attack gracefully. The gradual vortex lift roll-off above 25° is why delta configurations appear on fighters and supersonic aircraft that must operate across extreme flight regimes.
- Tare corrections are essential for accurate force balance data. Without the image-invert method, structural interference from the mount hardware would contaminate every measurement — a fundamental discipline in professional wind tunnel testing.
- The drag polar compresses all performance information into a single curve. Reading it to extract CD0, K, and the best-glide point is a core skill for aircraft sizing, mission analysis, and performance optimization.
- Gained direct experience operating a closed-circuit facility, applying multi-variable test matrix design, and analyzing six-degree-of-freedom aerodynamic datasets — skills directly applicable to industry wind tunnel programs.